Spotting contaminated ground from vegetation stress in satellite imagery
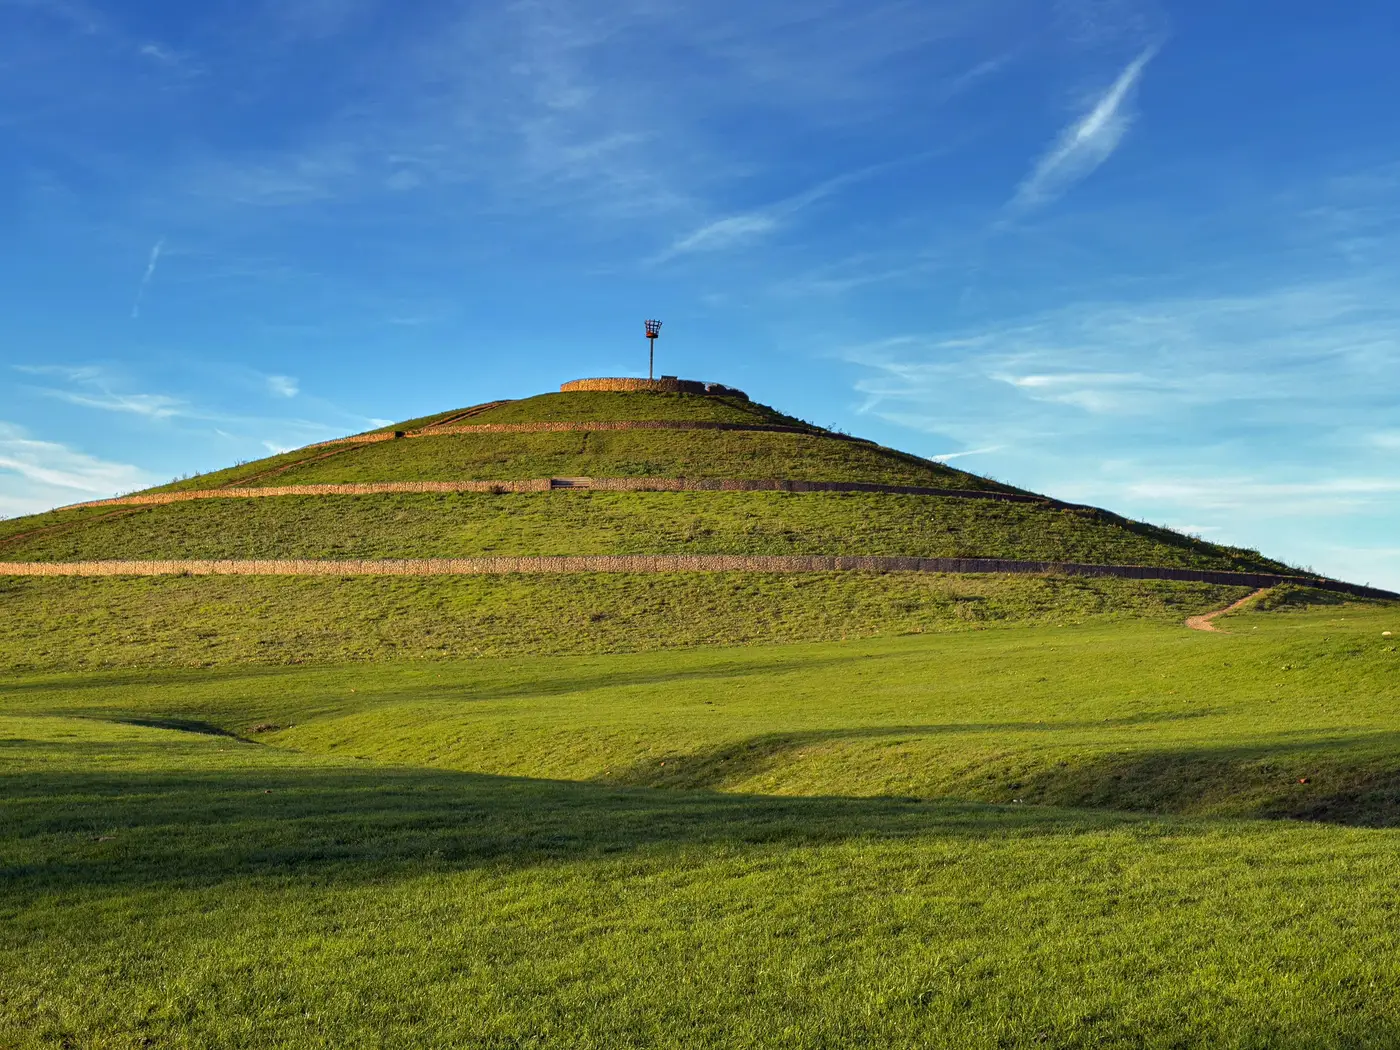
Vegetation doesn't fail evenly. When a closed landfill cap breaks down, when leachate migrates off the edge of a spoil heap, or when old industrial ground has heavy metals sitting a few inches under the topsoil, the plants growing over it show it before anyone walks the site. That's the starting point for using vegetation stress as a screening signal for contaminated or disturbed ground, and why it matters for anyone building a first-pass list of brownfield candidates instead of starting from a planning register.
What vegetation stress looks like in multispectral data
A standard RGB image shows you green or brown. Multispectral sensors add bands a normal camera skips, near-infrared and red-edge among them, because healthy chlorophyll reflects strongly in those wavelengths before it shows up in visible green. When a plant is stressed, chlorophyll production drops and that near-infrared reflectance falls off, often before the leaf visibly yellows.
Run the near-infrared and red bands through a vegetation index, NDVI being the common one, and the output is a stress map rather than a stress guess: a numeric value per pixel instead of "that patch looks a bit off from the fence line." Low NDVI sitting in a ring or patch inside an otherwise green field is the signal worth chasing.
Patterns that point to contamination, not drought
A dry summer stresses vegetation too, so the index alone doesn't tell you about contamination. What does is the shape and the persistence of the stress.
Drought stress tends to follow the whole field evenly, worse on high ground, lighter in the hollows. Contamination stress tends to sit in shapes that match buried infrastructure: a dead ring tracking the perimeter of an old tip cell, a linear strip following a pipe run or a historic drainage channel, a patch that stays stressed across wet years as well as dry ones, which a drought signal won't do. Cross-reference that against the parcel's land-use history, an old quarry footprint, a known spoil tip, a site flagged on legacy mapping, and a stress patch lining up with that footprint stops being ambiguous.
Timing matters as much as shape. Pull the same patch across a few imagery dates in one growing season. Grass or scrub that greens up on schedule everywhere else but lags or never recovers in one spot is behaving differently to ground that's just thirsty. An annual cadence of imagery lets you watch the same parcel year over year instead of judging it off a single pass.
Why this matters before the desk study
None of this replaces a Phase 1 report or soil sampling. A stress signature in a vegetation index tells you where to look, not what's in the ground. But for a land planner working through a long list of candidate parcels, that's exactly the gap that costs time. Trawling historical land-use records site by site to find closed landfills, old spoil heaps and former quarries takes resources most teams don't have spare, and a lot of that ground never made it onto a tidy register in the first place.
A vegetation stress pattern that lines up with a disturbed-ground shape does two useful things at once. It flags land that already carries the planning goodwill of being degraded rather than productive farmland, and it gives a land planner a ranked starting point instead of a blank map. From there, the desk study and the site visit can focus on the parcels actually worth the trip.
Brownfield Solar Sites builds that starting list from high-resolution multispectral satellite imagery on an annual cadence, turning stress patterns like these into a numbered candidate dossier before anyone opens a historical land-use record.
If your shortlist still starts with a records search instead of a map, it's worth seeing what the imagery already shows.